Increased levels of overseas migration and population growth has been widely covered at the macro level in Australia post COVID-19.
However, what has not been analysed as extensively is migration trends at the more localised suburban level.
Why is this important?
Because overseas and internal migration contain differing characteristics; population growth in one localised area can be fundamentally different to another.
The ABS recently released data that covers components of population growth for varying geographies over the year ending June 2023.
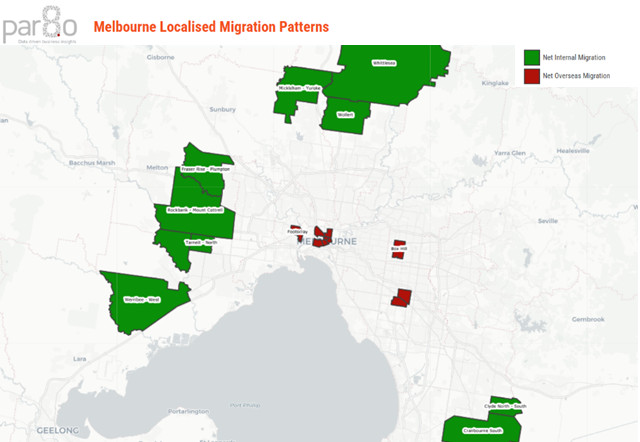
The Par8o map and tables below track the top ten Statistical Area Level 2 (SA2) geographies in Melbourne for net internal migration and net overseas migration in 2023.
The contrast is evident, the highest levels of internal migration were recorded in lower density greenfield growth corridors, while net overseas migration was strongest in higher density inner-city locations, or middle ring infill development areas.

Understanding localised migration patterns like the above can influence strategic business decisions that drive commercial value.
Par8o has developed a geospatial platform that covers every SA2 area in Australia to enable efficient analyses of localised migration patterns.
Please reach out to discuss further.