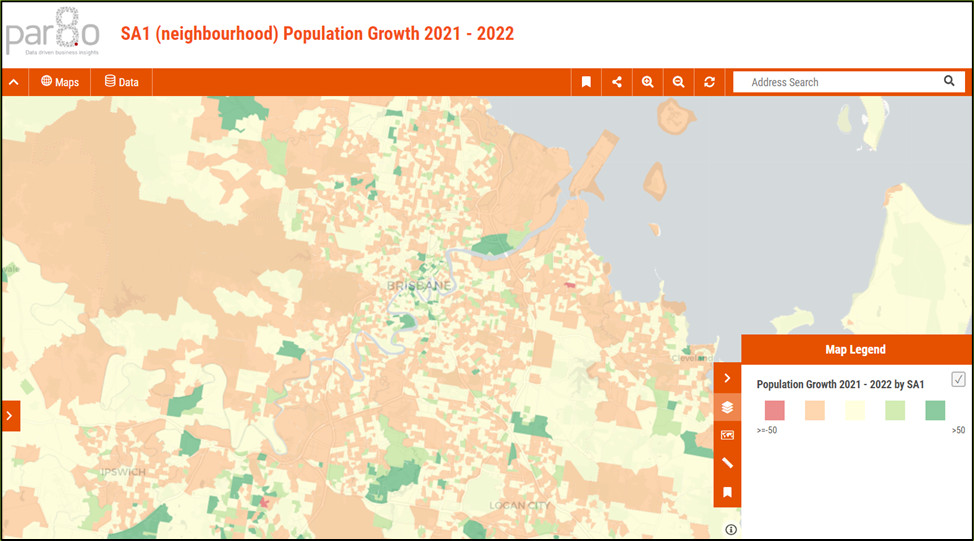
[vc_row][vc_column][vc_column_text]Where would your assets, projects or businesses sit on these maps of Brisbane, Sydney and Melbourne?
Surrounded amongst a sea of green, red, or egg shell white?
Population growth at the local neighbourhood level, amongst the sea of green, is a positive story you may like to tell visually.
Declining population at the local neighbourhood level, amongst the sea of red, is not such a positive story; but one you may need to hear sooner, as opposed to later.
Eitherway, geospatial mapping can tell a compelling story in a world where volumes of data can create white noise, uncertainty and errors in decision making.
Please reach out if you would like to know where you really sit on the map.
peter@par8o.com.au[/vc_column_text][/vc_column][/vc_row][vc_row][vc_column][vc_media_grid grid_id=”vc_gid:1694991299965-daeda02c-fb6e-1″ include=”1368,1369,1370″][/vc_column][/vc_row]


